307 kWp Rooftop Solar PV, C&I shed, Hooghly district, West Bengal
This document records the design, energy yield, grid connection and RESCO financial model of a 307 kWp rooftop PV plant on an assumed warehouse roof in Hooghly district.
| Parameter | Value | Src |
|---|---|---|
| DC / AC capacity | 307.4 kWp / 220 kVA | P |
| Modules | 544 × 565 Wp | V |
| String configuration | 32 × 17 modules | V |
| Inverters | 2 × 110 kVA | P |
| Annual yield, P50 | 409.2 MWh | P |
| Specific yield | 1,331 kWh/kWp | P |
| Performance ratio | 84.9 % | P |
| Self-consumption | 92 % | A |
| RESCO tariff, year 1 | ₹5.65 /kWh | A |
| RESCO IRR / payback | 19.4 % / 5.3 yr | A |
| Client saving, yr 1 / 25 yr | ₹5.28 lakh / ₹1.60 cr | A |
Src: V verified, P partly verified, A assumed or computed from assumed inputs (key in Section 7).
1Site and roof
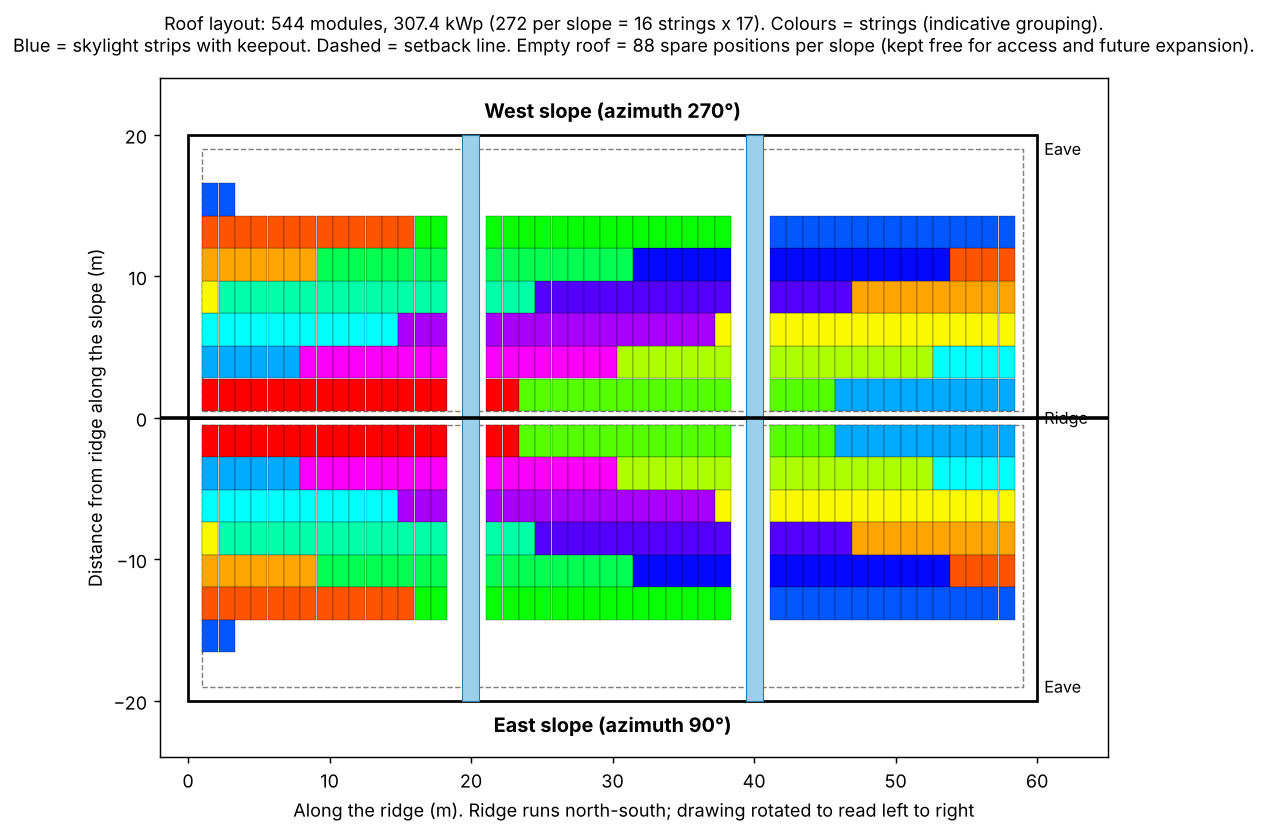
The roof is a metal-sheet shed with a 60 m ridge and two 20 m slopes facing east and west at 7° tilt (DWG-01). After setbacks and two skylight strips per slope, 1,983 m² of the 2,400 m² roof is usable (83 %). All roof data are assumed; no site survey has been carried out.
| Item | Value | Src |
|---|---|---|
| Roof type | Metal sheet on steel purlins, gable | A |
| Dimensions | 60 m ridge × 2 slopes of 20 m = 2,400 m² | A |
| Orientation | Ridge N–S; slopes E (90°) and W (270°) | A |
| Tilt | 7° | A |
| Setbacks | 1.0 m at eaves and gable ends, 0.5 m at ridge | A |
| Skylights | 2 strips per slope, 1.2 m wide, 0.5 m clearance each side | A |
| Usable area | 1,983.2 m² (83 %) | A |
2Plant design
Plant size is the smallest of three limits, rounded down to whole strings and split equally between the two slopes.
| Limit | Value | Src |
|---|---|---|
| Roof area | 407 kWp | A |
| Grid rule (350 kVA × 0.95) | 332 kW | P |
| Daytime load | 321 kWp | A |
| Selected | 307.4 kWp |
| Item | Value | Src |
|---|---|---|
| Modules | 544 × Waaree BiN-08-565, 565 Wp = 307.4 kWp | V |
| Modules per string | 17; 16 strings per slope | V |
| String Voc at 3.4 °C | 931.8 V (limit 1,000 V) | V |
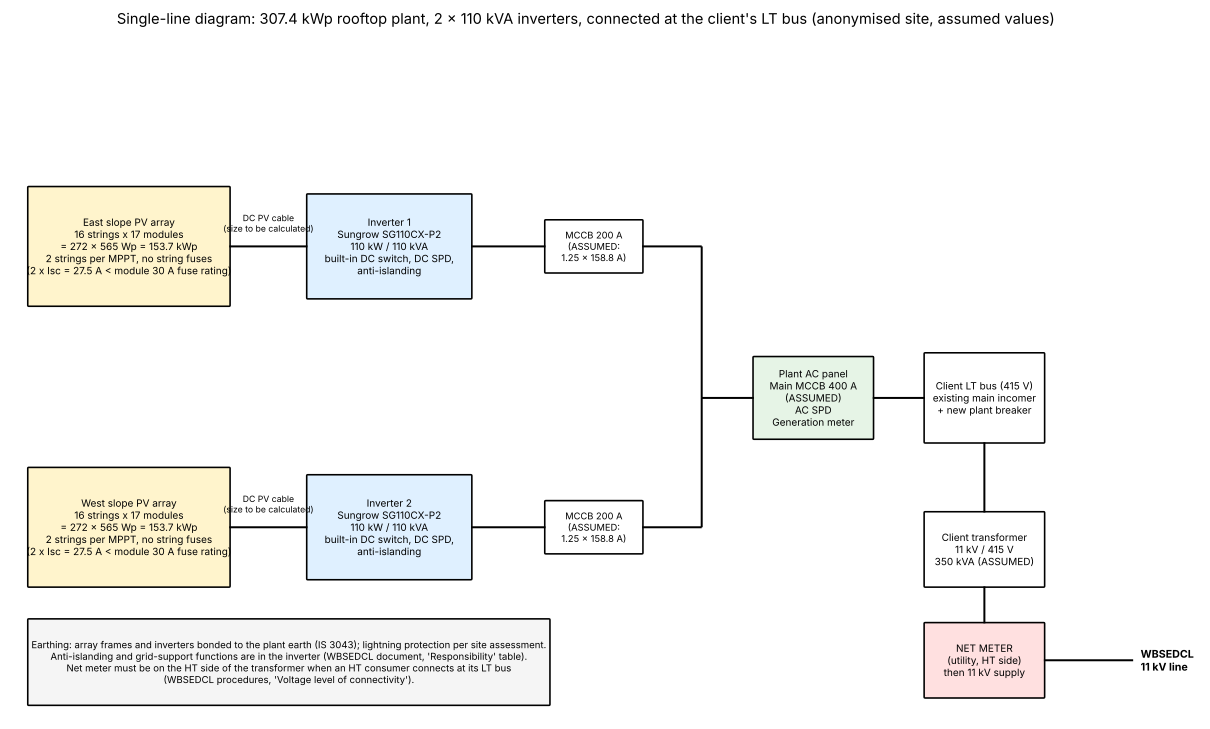
| Inverters | 2 × Sungrow SG110CX, 110 kVA; DC/AC 1.40 | P |
| Strings per MPPT | 2, same slope; 25.9 A against a 26 A limit | V |
| Wind speed, Kolkata | 50 m/s | P |
Note 1, string length. The open-circuit voltage of a string rises as it gets cold. At the assumed record low of 3.4 °C, 18 modules would give 986.7 V, only 1.3 % under the 1,000 V connector limit, so 17 are used. The hot-cell maximum-power voltage with 17 modules is about 629 V, inside the 200–1,000 V tracking window.
Note 2, wind. Flush-mounted modules weigh about 0.12 kN/m². The governing checks are clamp pull-out and purlin strength, which need the actual roof and a structural engineer.
3Energy yield
3.1Annual yield
PVsyst 7.4.7 gives 409,153 kWh a year (1,331 kWh/kWp, performance ratio 84.9 %). East–west orientation costs about 6 % against the best single tilt and spreads output across the day, which suits a two-shift factory.
Fig. 3.1Monthly energy to the grid, MWh (PVsyst).
| Step | Loss | Src |
|---|---|---|
| Incidence angle on glass | 2.76 % | P |
| Cell temperature | 7.52 % | P |
| Module mismatch | 2.00 % | P |
| DC cable resistance | 0.88 % | P |
| Inverter efficiency | 2.13 % | P |
| Inverter clipping, DC/AC 1.40 | 0.32 % | P |
Note 3, limits of the simulation. Soiling, shading and downtime are set to zero, the weather is synthetic data for Kolkata (about 30 km from Hooghly), and the bifacial module is treated as single-sided. Real output will be lower. The PVsyst licence showed 0 days remaining when the run was made; the run completed normally but should be repeated on a valid licence before the results are treated as final.
3.2Solar output and factory load, average day
Average solar output and assumed factory load for a chosen plant size, month and day type.
Fig. 3.2Solar output (PVsyst, Kolkata weather, 2 slopes at 7°) and factory load (assumed two-shift manufacturer, 120,000 kWh a month). Source: P and A.
Table of values for Fig. 3.2
4Grid connection
The factory takes power at 11 kV through its own transformer. WBSEDCL procedures allow an HT consumer to connect its plant at its low-voltage bus, provided the net meter is on the high-voltage side of the transformer.
| Item | Value | Src |
|---|---|---|
| Application fee, HV | ₹5,000 | V |
| Feed-in rate, HV, FY 2025-26 | ₹3.89 per kWh | V |
| Grid energy charge, 11 kV industry, Rate E(B) | About ₹7.06 per kWh (707 / 706 / 705 P/kWh by season) | V |
| Demand charge, Rate E(B) | ₹384 per kVA per month | V |
| RESCO ownership | Allowed, through a service provider | V |
| Periodic re-testing | Every 2 years above 170 kW | V |
Note 4, capacity cap. The utility document pairs 170 kW with 200 kVA, a power factor of about 0.85. If the cap means kWp at that ratio, a 350 kVA contract demand allows 297.5 kW, and this plant (307.4 kWp) would exceed it by 9.9 kWp; the alternative is 28 strings, 269 kWp. The documents do not say which reading applies. The larger size is retained and the question is open (Section 7).
5RESCO financial model
A RESCO owns the plant and sells the solar energy used on site to the factory at a discount to the grid energy charge. The calculator below runs the same arithmetic as resco/model.py in the repository.
| RESCO IRR19.4 % | Payback5.3 yr |
Fig. 5.1Cumulative cash of the RESCO, ₹ lakh, by contract year. Marker: simple payback.
5.1Basis
Grid price: WBSEDCL 11 kV industry Rate E(B), about ₹7.06 per kWh (V); the fuel-cost adjustment (MVCA) is charged on top and is not included. Capex: two installer pages (P). Maintenance, escalation and discount: assumed (A). Tax, loans and inverter replacement are not modelled, and the client is given no credit for lower demand charges (₹384 per kVA per month).
5.2Summary of results
At about ₹7 per kWh, a RESCO that discounts 20 to 30 % earns roughly 17 to 19 % a year on its capital (no tax or loan), and the factory saves ₹5 to ₹8 lakh in year 1 with no capital outlay. The largest risks are capex (installer pages, not a quotation), real yield (soiling and shading not yet modelled) and the reading of the capacity cap. If the factory is on the time-of-day scheme, the return is about 19.0 % instead of 19.4 %.
6Commissioning and safety
The repository holds a commissioning checklist with expected readings worked from the design: a healthy 17-module string should read about 882 V open-circuit at 25 °C cell temperature and 836 V at 45 °C (P). A one-page safety note covers falls through skylights, strings that cannot be switched off in daylight, and DC fire.
The test list follows an installer's summary of IEC 62446-1. The standard itself was not available to read, so acceptance ranges are common practice, not clauses.
7Assumptions and open items
Every value is logged with its source in VERIFICATION.md and every design choice with its reason in ASSUMPTIONS.md.
V verified against the cited document · P partly verified (secondary source, single source, or a variant of the part) · A assumed, or computed from assumed inputs; the reason is logged.
| Item | Src | Open action |
|---|---|---|
| Roof geometry, client, load profile | A | Replace with a surveyed roof and a real bill |
| Module and inverter specifications | V P | Check the ALMM listing of this exact model; the PVsyst inverter variant differs slightly |
| WBSEDCL rules and tariffs, FY 2025-26 | V | Read the regulation gazette text and the FY 2026-27 order; add the fuel-cost adjustment (MVCA) |
| Capex, RESCO terms | P | Obtain a quotation |
| Maintenance, escalation, base discount | A | Agree with the client |
| Soiling and shading losses | A | Not modelled (zero); add to PVsyst and re-run on a valid licence |
| Wind loads, fire setbacks | A | Structural engineer and fire authority |
| Capacity cap (332 kW or about 297 kW) | P | Confirm the unit and power factor with WBSEDCL |
About this study
The roof and the client are assumed and anonymised; this is a design study, not a real client project. Design decisions, inputs and checks are the author's; AI tools assisted with scripting and documentation. No AI-generated images are used; the drawings are produced by scripts in the repository.